
In a world driven by data, automation is no longer a luxury; it’s a necessity. Whether you’re a QA manager tracking test automation, a business analyst presenting monthly KPIs, or a developer logging errors in a dashboard, the pressure to deliver fast, consistent, and accurate reports is real. That’s where automated reporting tools come in. These tools automate reporting processes, helping teams shift from manual reporting to streamlined automation report generation that offers real-time analytics and actionable insights.
This blog will walk you through everything you need to know to automate reporting effectively using modern automation tools and reporting software. You’ll learn how to build an automation report, explore different types of test reports, and uncover best practices to get the most out of your test automation dashboard. Whether you’re using Excel, Power BI, or a customizable reporting platform, this guide is for anyone looking to streamline their reporting system and make data-driven decisions.
Why Automation Is Critical in Modern Reporting?
The demand for real-time data and data-driven decision-making has forced organizations to rethink how they generate reports. Manual methods are not only error-prone but also time-consuming and inefficient. That’s why many are turning to report automation: the process of using automation software or reporting tools to automatically generate reports on a set schedule or trigger.
With the right automated reporting tool, you can eliminate repetitive tasks, streamline workflows, and ensure test reports and business reports are consistent and accurate. This is particularly vital in fields like QA, where test automation is already standard, and reporting must keep pace with rapid development cycles.
Reddit users say automating client reports is a game-changer for efficiency, though they debate which tools and levels of customization strike the right balance.
How does everyone here automate reports to clients?
byu/TheRiteGuy inexcel
Automation tools are specialized software tools designed to execute pre-configured actions, such as data collection, analysis, and reporting, without human intervention. These tools are often part of a larger test framework, business intelligence (BI) suite, or reporting software system, and are widely used in test automation, DevOps, marketing analytics, and more.
They integrate with various data sources, such as databases, applications, or APIs, and can generate detailed reports based on rules you set,like triggering a test automation report after a test run or sending an automation email once a sales threshold is crossed.
The Power of a Test Automation Dashboard
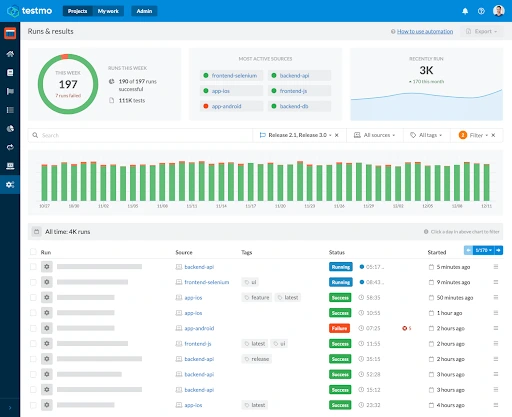
A test automation dashboard is a visual interface that provides a detailed view of test results, execution status, metrics, and trends. These dashboards are often built using reporting software or integrated into test automation platforms, giving QA teams the power to view real-time data and pinpoint failures quickly.
A well-designed dashboard includes:
- Pass/fail metrics for each test case
- Status of current test runs
- Historical data and trends across different builds or test suites
By consolidating all this data, the test automation dashboard helps stakeholders and testers understand what’s working, what’s failing, and what needs attention. It transforms raw data into actionable insights.
Reddit users say automating report generation and testing in CI helps catch issues early and ensures consistency, but they often warn it can introduce flaky tests and extra maintenance overhead.
Automating reports
byu/Ash23_tester insoftwaretesting
Benefits of Automated Reporting
The benefits of automated reporting go far beyond time savings. When you automate reporting, you gain:
- Consistency: Reports are generated in the same format every time, minimizing human error.
- Efficiency: Automated workflows lessen the time spent on compiling data.
- Real-time insights: View performance indicators and test results as they happen.
- Customization: Use customizable templates to tailor reports to different stakeholders.
- Scalability: Run complex reporting tasks with ease as your data grows.
For example, an automation email system can be set up to send daily or weekly test reports to developers and managers, keeping everyone aligned and eliminating status meetings.
What Are Automated Reports?
Automated reports are data summaries generated without manual intervention using automation tools or reporting software. They are typically created on a schedule or when triggered by specific events,like the completion of a test suite or a change in sales metrics.
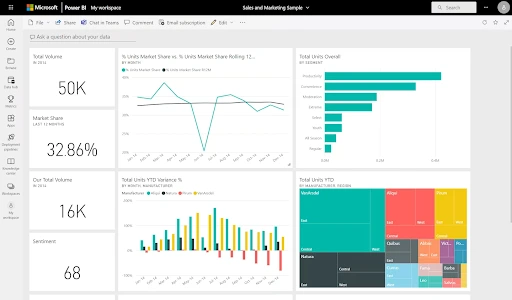
These reports can be in Excel, PDF, or integrated into BI platforms like Microsoft Power BI. They’re often built using customizable templates, allowing teams to create automated reports that match specific reporting needs.
Example: In a QA environment, after every test run, the system can generate a test automation report showing:
- Number of tests executed
- Success and failure metrics
- Bugs linked to failed test cases
This type of report provides insights that developers can act on immediately.
How Are Automated Reports Generated?
Here’s how automated reporting typically works inside an automation tool:
1. Data Collection and Integration
The tool pulls data from relevant sources—test results, CRM systems, marketing platforms, or financial databases. Integration with platforms like Microsoft Power BI or custom databases is common to meet diverse reporting needs.
2. Data Processing and Analysis
Using built-in scripts, machine learning, or logic rules, the tool processes raw data into useful metrics and performance indicators. This might include pass/fail rates for test cases, revenue growth, or campaign ROI.
3. Template-Based Report Generation
Reports are generated using customizable templates that define the format, layout, and data visualizations. This ensures uniformity across reports while allowing flexibility for various stakeholders.
4. Visualization and Dashboard Updates
The results are displayed through dashboards and reports often interactive,allowing teams to explore analytics, KPIs, and historical trends. These dashboards help provide insights at a glance.
5. Distribution and Automation Email Triggers
Once the automation report is ready, it can be automatically shared via scheduled emails, Slack, or exported to PDF/Excel. This reduces dependencies and ensures that all stakeholders have timely access to key data.
Reddit users debate whether to lean on scheduled scripts or BI tool automation for weekly reports, with strong proponents on both sides of the aisle.
What’s the best way to automate this reporting process that happens weekly?
byu/ecubugg inexcel
What Is the Automation Summary Report?
An automation summary report is a high-level overview of automated test execution. It usually includes:
- Total number of test cases run
- Pass/fail rates
- Error logs and analytics
- Execution time per test case
- Comparison with previous builds
These reports help project managers and QA leads assess the test automation process and make informed decisions about build quality, release readiness, and resource allocation.
What Is an Example of Automation Documentation?
Automation documentation refers to the written records detailing the automation process, tools used, configuration settings, and expected outcomes. An example could include:
- Overview of the test framework
- Description of the automation tool used
- Sample automation report or test report
- Guidelines on how to trigger the automation email system
- Templates for future report generation
This documentation is crucial for onboarding new team members and ensuring consistency in test automation.
How to Automate Reports in Excel?
Excel remains a widely-used reporting tool, and yes, you can automate reports in Excel using built-in features like:
- Power Query: For connecting to databases and transforming data
- Macros/VBA: For repetitive tasks and custom workflows
- Power BI integration: To build live dashboards and visualizations
Steps to automate reports in Excel:
- Connect Excel to your data source (SQL, CSV, etc.)
- Build your report using PivotTables and charts
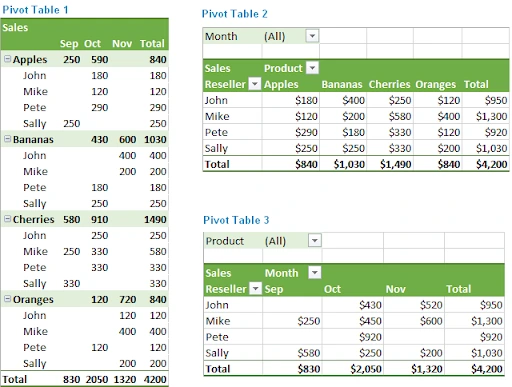
- Use macros to refresh data and generate reports
- Schedule automation using Task Scheduler or Power Automate
This approach helps meet basic reporting needs while saving time and ensuring consistency.
Choosing the Right Automated Reporting Tool
Selecting the best automated reporting tool depends on your specific use case. Whether you need to report on test results, business KPIs, or marketing performance, there are several tools designed to meet various reporting needs.
Some popular reporting tools include:
- Power BI: Great for data-driven analytics and customizable dashboards
- Tableau: Known for beautiful visualization and interactive dashboards
- JasperReports: An open-source option suitable for embedding in custom apps
- Allure TestOps or ReportPortal: Specialized test reporting tools for QA teams
Each of these reporting platforms offers different reporting features, including scheduled exports, permission controls, and API integration with your existing test automation framework.
Best Practices of Automated Reporting
To get the most out of your report automation, follow these best practices of automated reporting:
- Define clear KPIs and performance indicators: Know what you’re measuring before creating the report.
- Use templates: Create customizable reports that suit different stakeholders.
- Integrate with your tech stack: Use APIs to link your reporting software with CRM, ERP, or test automation tools.
- Prioritize security: Ensure only authorized users can create reports or share reports.
- Focus on visualization: Good dashboards make complex data easy to digest.
By following these practices, your automation setup won’t just generate reports—it’ll deliver actionable insights.
Use Cases of Automated Reporting in QA and Business
Let’s break down a few common use cases for automated reporting:
1. QA and Test Automation
- After every test run, the system auto-generates a test automation report.
- Reports include test results, defect trends, and environment logs.
- The data is visualized on a test automation dashboard for dev and QA teams.
2. Sales Performance
- Weekly reports highlight key metrics like leads, conversions, and revenue.
- Auto-shared with sales managers via automation email.
3. Marketing Campaigns
- Analytics and ROI data pulled from platforms like Google Ads, LinkedIn Ads, or Meta.
- Displayed in a dashboard powered by Power BI for campaign review.
These use cases demonstrate how automation can streamline reporting systems across different departments.
Full Automation vs Partial Automation in Reporting
There are levels to automation:
- Full Automation: From test execution to report creation and automation email delivery—all done with no manual input.
- Partial Automation: Some steps, like data reporting or visual generation, may still require human involvement.
Deciding between full and partial automation depends on the software tools used, the complexity of your reporting needs, and the stakeholders involved.
Conclusion: The Future of Reporting Is Automated
As data grows, so does the need to automate. Whether you’re managing a test suite, tracking sales metrics, or optimizing campaigns, report automation helps you scale your insights without scaling your workload.
Using an automated reporting tool allows you to create automated reports that are consistent, real-time, and tailored to different audiences. With customizable dashboards, automation email triggers, and integrations with tools like Power BI, reporting becomes more about interpretation and less about compilation.
Now is the time to move beyond manual reporting. Embrace automation software and start building a future where reports not only reflect the past but also guide the way forward. Use the right reporting software, adopt best practices, and let automation do the heavy lifting—so your team can focus on making data-driven decisions that truly matter.